Problem Solving Techniques
Problem Solving Techniques
- To decide which problem to be addressed first (or next)
- Define the problem in terms of What it is, Where it occurs, When it Happens, and its extent
- Find out all possible causes of the problems
- To agree on basic cause(s)bof the problem
- To develop effective and implementable solution and action plan
- Implement the solution and establish needed monitoring procedure and chart
The Seven QC Tools
It is a set of Graphical technique for problem solving related to quality
The seven tools are:
- Cause-and-effect diagram (also known as the "fishbone" or Ishikawa diagram)
- Check sheet.
- Control chart.
- Histogram.
- Pareto chart.
- Scatter diagram.
- Stratification (alternately, flow chart, run chart, Pie Chart, Bar chart), Brainstorming
Selection of QC Tools for Problem Solving Techniques
1 To decide which problem to be addressed first (or next)
- Check Sheet
- Pareto Chart
- Brainstorming
2 Define the problem in terms of What it is, Where it occurs, When it Happens, and its extent
- Histogram
- Run Chart
- Check Sheet
- Pareto Chart
- Pie Chart
3 Find out all possible causes of the problems
- Cause and Effect Diagram
- Brainstorming
- Check Sheet
4 To agree on basic cause(s)bof the problem
- Check Sheet
- Pareto Chart
- Scatter Diagram
5 To develop effective and implementable solution and action plan
- Brainstorming
6 Implement the solution and establish needed monitoring procedure and chart
- Pareto Chart
- Histogram
- Control Chart
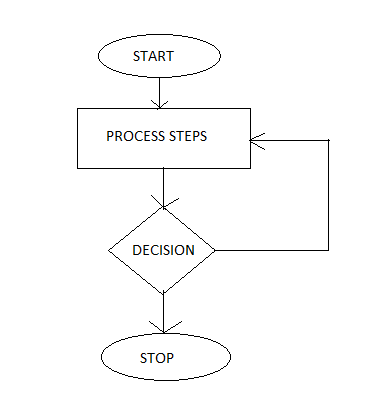
Flow Chart
Flow chart is used to identify actual or ideal path of the process to identify deviations.Examples:
Check Sheet
Check sheet are used to answer the question “ How often are certain events happening ?”
Example:Defect Types
DefectMayTotal21222324Wrong Printing on Productllll lllllllll lllllll ll26High ODlllllllll9low ODlllllll8High wall thicknesslllllll7Low wall thicknessllll llll llllllll llllllll llll llllll llll llll52Total29222526102Pareto Chart
* When you need to display relative importance of all problems , to choosestarting point for problem solving, to monitor, to identify main cause of a problem* To identify most important problems through the use of differentmeasurement scale e.g. frequency, cost etc.Example :


Cause and Effect Diagram
When you need to explore all possible causes of a Problem
The major causes might be summarized under four categories referred to as 4M’s : Manpower, Machines, Methods and materials
Examples :


Run Chart
When you need to display of trends within observation points over a specified time
Examples :


Histogram
A histogram shows the distribution of the data, central tendency, variability, and shape.
A histogram has generally bell shaped curve
Examples :


888 Casino NY - Mapyro
ReplyDelete888 Casino NY · New York 강원도 출장마사지 United States · Las Vegas Nevada United States · Las Vegas 통영 출장샵 NV · Atlantic 충청북도 출장샵 City NJ · 제주도 출장마사지 Paris NJ United 천안 출장안마 States.